Your query is slow. Postgres already told you why.
The usual sequence when something goes sideways: someone pastes a slow query into Slack, someone else runs EXPLAIN, a third person SSHes into the box and stares at top. Forty minutes later you know the plan is fine and the CPU is at 30% and you still have no idea what's wrong.
📖 Read the full guide: Postgres Wait Events: What Every Backend Is Blocked On
▶ Watch the video walkthrough: Postgres Wait Events: What Your Database Is Really Waiting On
https://www.youtube.com/watch?v=8_7iDBquAjA
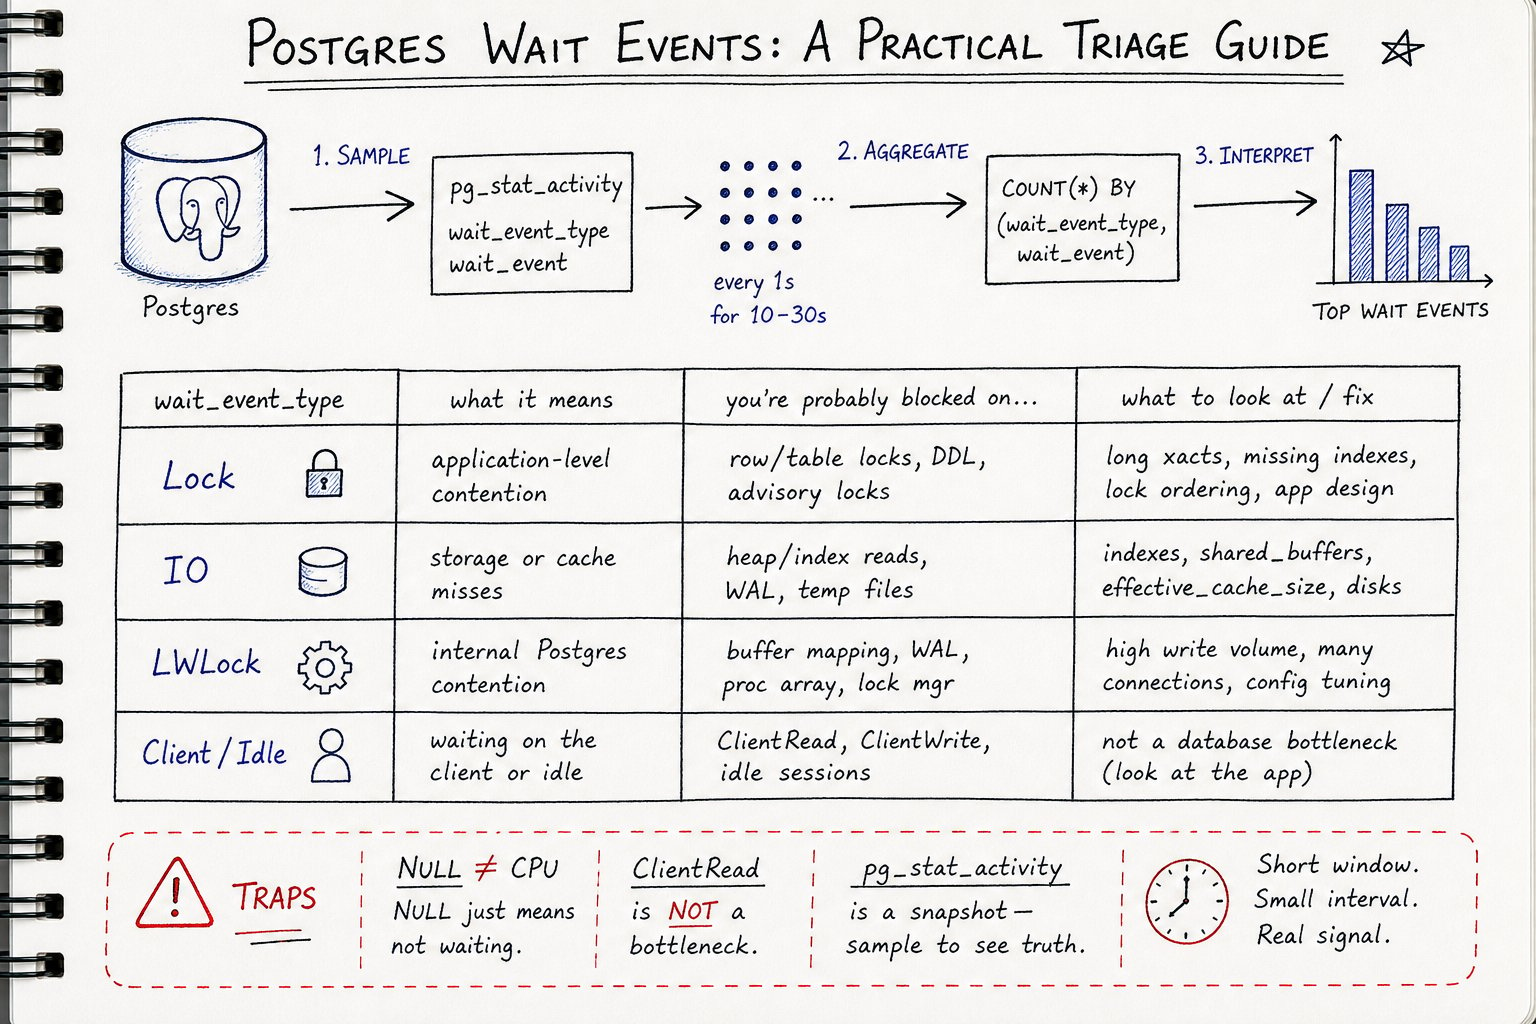
You skipped a step. Before you ask what is this query doing, ask what is this backend waiting on. Postgres has answered that question in pg_stat_activity since 9.6, in two columns most people scroll past on their way to the query text.
The two columns that matter
pg_stat_activity has wait_event_type and wait_event. The type is a coarse category (Lock, IO, LWLock, Client, IPC, Timeout, BufferPin, Activity, Extension). The event is the specific thing inside that category: transactionid, DataFileRead, WALSync, ClientRead.
Before 9.6, all you got was a boolean waiting column, and it only covered heavyweight lock waits — nothing about I/O, nothing about internal contention. 9.6 was the release where Postgres started telling you the truth about idle time, I/O time, and internal contention, not just lock contention. That's the baseline you're working with.
When both columns are NULL, the backend is not currently waiting on a tracked wait event.
Read that caveat carefully, because it's where most people go wrong. NULL does not strictly mean "on CPU." It means the backend is not sitting in a wait-event-instrumented sleep at that instant. Instrumentation in Postgres is added explicitly, site by site, in the source. Not every code path has it. So NULL is best read as "running, probably on CPU, possibly in an uninstrumented sleep." In practice a histogram dominated by NULL means your problem is CPU or plan efficiency, and you should go back to EXPLAIN. Just don't treat it as a measurement.
Here's the raw view with the columns that are actually useful:
SELECT pid,
       backend_type,
       state,
       wait_event_type,
       wait_event,
       now() - xact_start AS xact_age,
       now() - query_start AS query_age,
       left(query, 80) AS query
FROM pg_stat_activity
WHERE backend_type = 'client backend'
  AND pid <> pg_backend_pid()
ORDER BY xact_age DESC NULLS LAST;
That backend_type = 'client backend' filter is not optional. pg_stat_activity includes the checkpointer, walwriter, the autovacuum launcher, and the logical replication launcher. Those processes sit in Activity-type waits (CheckpointerMain, WalWriterMain, AutoVacuumMain) essentially all the time, by design. Leave them in and they will be the top rows of every histogram you ever build, forever, and they mean nothing.
If you're on PostgreSQL 17 or later, there's also pg_wait_events, a system view listing every wait event name, type, and description. Join it against pg_stat_activity when you hit an event you don't recognize instead of guessing from the name.
Why one snapshot lies to you
pg_stat_activity reports instantaneous state. It's a photograph, not a stopwatch. Core Postgres does not accumulate per-backend wait time anywhere, so there is no total_time_waiting_on_DataFileRead column to query. There never has been.
The consequence: a query that spends 90% of its life blocked on IO:DataFileRead will show NULL if you happen to look during the other 10%. Run the query three times, get three different answers, conclude that wait events are useless, go back to top. I've watched engineers do this.
The fix is statistical. Take N samples over the slow window. The number of samples in which you observe a given wait event is proportional to the time backends spent in that event. Sample 600 times over 60 seconds and a wait that shows up in 420 of them accounts for roughly 70% of your backends' time. That's a profile.
On interval: 1 second is fine for a "what is going on right now" look during an ongoing incident. 100ms is what I use when I want a defensible histogram, because it catches shorter waits and gives you 600 data points in a minute instead of 60. Below 100ms you're mostly measuring your own sampler. Each sample is a scan of the proc array; on a box with 40 backends it's negligible, on a box with 2,000 connections it is not, and at that point you have a different problem anyway (see the LWLock section).
The sampling recipe
Three options, escalating.
1. The 60-second look
Save this in a file called waits.sql and never think about it again:
SELECT coalesce(wait_event_type,'CPU/none') AS type,
       coalesce(wait_event,'-') AS event,
       count(*)
FROM pg_stat_activity
WHERE backend_type='client backend'
  AND pid<>pg_backend_pid()
GROUP BY 1,2
ORDER BY 3 DESC;
\watch 1
Run it, let it tick for a minute, watch which rows stay fat. This is eyeballing, not measurement, but it's fast and it usually points you at the right branch within thirty seconds.
2. The real sampler
When you need numbers you can put in a postmortem, write the samples down.
CREATE UNLOGGED TABLE IF NOT EXISTS wait_samples (
  sampled_at        timestamptz NOT NULL DEFAULT clock_timestamp(),
  pid               int,
  state             text,
  wait_event_type   text,
  wait_event        text,
  usename           text,
  application_name  text,
  xact_start        timestamptz
);
UNLOGGED matters. You're about to write tens of thousands of rows during an incident and you do not want that traffic in the WAL, especially if the thing you're diagnosing is WAL-bound.
The sampler itself:
INSERT INTO wait_samples
  (pid, state, wait_event_type, wait_event, usename, application_name, xact_start)
SELECT pid, state, wait_event_type, wait_event, usename, application_name, xact_start
FROM pg_stat_activity
WHERE backend_type = 'client backend'
  AND pid <> pg_backend_pid();
Drive it from a shell loop for 100ms resolution:
for i in $(seq 1 600); do
  psql -qAtX -d mydb -f sampler.sql >/dev/null
  sleep 0.1
done
If you have pg_cron installed you can schedule it, but cron granularity is a minute, so you'd need a wrapper that loops internally. The shell loop is less clever and works everywhere.
Then the histogram:
WITH totals AS (
  SELECT count(*)::numeric AS backend_samples,
         count(DISTINCT sampled_at) AS ticks
  FROM wait_samples
  WHERE sampled_at > now() - interval '10 minutes'
)
SELECT coalesce(w.wait_event_type,'CPU/none')  AS type,
       coalesce(w.wait_event,'-')              AS event,
       count(*)                                AS samples,
       round(100 * count(*) / t.backend_samples, 1) AS pct_of_backend_time,
       round(count(*)::numeric / t.ticks, 2)   AS avg_backends_waiting
FROM wait_samples w, totals t
WHERE w.sampled_at > now() - interval '10 minutes'
GROUP BY 1, 2, t.backend_samples, t.ticks
ORDER BY samples DESC
LIMIT 25;
avg_backends_waiting is the column I actually read. "18% of samples were Lock:transactionid" is interesting; "on average 7.4 backends were blocked on Lock:transactionid at any given moment" is a number you can take to the application team.
3. Continuous profiling
If you want this always-on rather than incident-only, pg_wait_sampling is the extension. It samples wait events in shared memory on its own schedule and exposes both a current profile and a history, so you get accumulated wait counts without a polling loop and without a table full of raw samples. It's third-party, so check whether your platform allows it before you plan around it.
Pair it with pg_stat_statements for per-query timing and track_io_timing for real block read/write times. track_io_timing is off by default; turn it on and EXPLAIN (ANALYZE, BUFFERS) and pg_stat_statements start reporting actual IO time, which is how you corroborate an IO-heavy histogram instead of just believing it.
Reading the histogram
| wait_event_type | What it means | Who owns the fix | Actionable? |
|---|---|---|---|
Lock |
Waiting on a heavyweight lock, the same ones in pg_locks |
Application: transaction shape, DDL timing | Yes, almost always |
LWLock |
Contention on an internal shared-memory structure | Postgres internals, driven by your scale | Indirectly: connections, write volume, config |
IO |
Reading or writing relation files or WAL | Storage, schema/index design, or shared_buffers |
Yes |
Client |
Waiting on the client to send or receive | Your application or the network | Usually no (one big exception) |
IPC |
Waiting on another Postgres process | Parallel query, replication machinery | Sometimes |
Timeout |
Deliberate sleep (e.g. vacuum cost delay) | Nobody, mostly | Rarely |
BufferPin |
Waiting for exclusive access to a buffer | Rare; usually accompanies other problems | Rarely, on its own |
Activity |
Background process idling in its main loop | Nobody. This is normal. | No |
Extension |
An extension's own wait event | Whoever wrote the extension | Depends |
Activity and Client are the noise floor. If you didn't filter backend_type they will dominate. If you did filter and Client still dominates, keep reading.
Lock waits: your queries fighting each other
wait_event_type = 'Lock' means a heavyweight lock, visible in pg_locks, and wait_event names the lock type: relation, transactionid, tuple, extend, virtualxid.
Lock:transactionid is the one you'll see most. It means the backend is waiting for another transaction to commit or abort, typically because it wants to update a row that an in-flight transaction already modified. That's row-level contention, and it is an application design problem 95% of the time.
Find the blocker. pg_blocking_pids() has existed since 9.6, the same release that gave you wait events, and it saves you from writing the self-join on pg_locks that everybody gets subtly wrong:
SELECT blocked.pid                       AS blocked_pid,
       blocked.wait_event_type,
       blocked.wait_event,
       now() - blocked.query_start       AS blocked_for,
       left(blocked.query, 100)          AS blocked_query,
       blocker.pid                       AS blocker_pid,
       blocker.state                     AS blocker_state,
       blocker.wait_event_type           AS blocker_wait_type,
       blocker.wait_event                AS blocker_wait,
       now() - blocker.xact_start        AS blocker_xact_age,
       left(blocker.query, 100)          AS blocker_query
FROM pg_stat_activity blocked
CROSS JOIN LATERAL unnest(pg_blocking_pids(blocked.pid)) AS b(blocker_pid)
JOIN pg_stat_activity blocker ON blocker.pid = b.blocker_pid
WHERE blocked.wait_event_type = 'Lock'
ORDER BY blocked_for DESC;
Look at blocker_state and blocker_wait. If the blocker is idle in transaction with ClientRead, your application opened a transaction and then went and did something else. That's the whole bug.
Lock:relation during business hours usually means someone ran ALTER TABLE or a non-concurrent index build. Use CREATE INDEX CONCURRENTLY and REINDEX CONCURRENTLY, and always set lock_timeout before DDL on a busy table. It aborts a statement that waits too long for a lock, which is the difference between a failed migration and a five-minute outage where every query behind the ACCESS EXCLUSIVE request piles up.
Lock:extend is different. It means backends are queued up to extend a relation file, which is the classic symptom of many concurrent INSERTs into one table. Batch your inserts into fewer, larger statements rather than firing one row at a time from 200 connections.
IO waits: pages that aren't in cache
IO:DataFileRead is recorded when a backend reads a data page from a relation file because it wasn't in shared_buffers. Important nuance: that read may still be served by the operating system page cache. DataFileRead does not prove physical disk activity. It proves a shared_buffers miss.
So a DataFileRead-heavy histogram has three possible causes, in the order I check them:
- A query reading far more blocks than it should. Bad plan, missing index, or a sequential scan on a table that outgrew its stats. Check with
EXPLAIN (ANALYZE, BUFFERS)andpg_stat_statements.shared_blks_read. shared_bufferstoo small for the working set.- Actual slow storage.
Fix them in that order, because option 1 is free and options 2 and 3 cost money.
WAL-side IO events read differently. IO:WALWrite and IO:WALSync are time spent writing and flushing WAL. Heavy WALSync means you're commit-rate-bound and limited by fsync latency on the WAL device. More IOPS sometimes helps; fewer commits almost always helps more. Wrap 1,000 single-row inserts into one transaction and your WALSync waits drop by three orders of magnitude.
If you genuinely cannot batch, synchronous_commit = off removes the per-commit wait for the WAL flush. The tradeoff is a window of recently committed transactions that can be lost on a crash. It does not risk corruption or torn state, so it's a data-recency decision, not a safety one. Make it per-transaction if you can: your audit writes probably need durability, your click-tracking table probably doesn't.
Read-bound and commit-bound problems get different fixes, and mixing them up wastes a day. Read-bound (DataFileRead dominant) is an indexing or plan problem, sometimes a shared_buffers sizing problem. Commit-bound (WALWrite/WALSync dominant) is about fsync latency, synchronous_commit, and commit batching. Know which one you're looking at before you touch anything.
LWLock waits: contention inside Postgres
LWLocks are lightweight locks protecting shared memory structures. They're held briefly and they never appear in pg_locks. In PostgreSQL 10 and later, the wait_event gives you the specific name (WALWrite, WALInsert, BufferMapping, BufferContent, LockManager, ProcArray). On 9.6 you got the generic LWLockNamed / LWLockTranche, which was nearly useless; if you're still there, this is one more reason to upgrade.
The mental model that matters: LWLock waits are usually a symptom of scale, not a knob. There is no lock_manager_partitions GUC.
LWLock:LockManager shows up with very high connection counts and high rates of lock acquisition. Lock manager partitioning is compile-time, not runtime-tunable, so the answer is fewer connections. Put PgBouncer in front of the database and get your backend count down to something proportional to your core count. I have seen LockManager contention disappear entirely by dropping from 900 direct connections to 60 pooled ones, with zero config changes on the server.
LWLock:WALInsert and LWLock:WALWrite mean write throughput. BufferMapping and BufferContent point at shared_buffers pressure and hot-page contention. In every case: pool first, reduce write volume second, tune config third. Reversing that order is how people end up with a postgresql.conf full of settings nobody can justify.
Client and IPC: the database isn't the problem
Client:ClientRead is the single most misdiagnosed wait event in Postgres.
It means the backend has finished its work and is waiting for the client to send the next command or data. It's a wait on your application or the network. Every normal idle session shows it. If your histogram is 80% ClientRead, the correct conclusion is that your connections are mostly idle and the database is bored.
The exception is real and dangerous. A session in state idle in transaction with wait_event = ClientRead is holding an open transaction snapshot. That snapshot prevents VACUUM from removing dead tuples newer than it, and the session may still hold locks it acquired earlier in the transaction. Long-running idle-in-transaction sessions cause bloat and block DDL. So always break ClientRead down by state:
SELECT state,
       count(*) AS samples,
       max(now() - xact_start) AS worst_xact_age
FROM wait_samples
WHERE wait_event = 'ClientRead'
GROUP BY 1
ORDER BY 2 DESC;
idle is fine. idle in transaction for more than a few seconds is a bug in your application. Set idle_in_transaction_session_timeout so it kills itself instead of you.
IPC waits mean one Postgres process is waiting on another: parallel workers finishing (BgWorkerShutdown, ParallelFinish), logical replication apply. Some ParallelFinish is normal in a parallel-heavy workload. Sustained high IPC alongside low CPU sometimes means your parallel workers are starved by max_parallel_workers.
Three histograms and what I did about them
Case 1: 60% Lock:transactionid. Checkout API, p99 up from 180ms to 9 seconds, CPU at 22%. The blocker query showed the same five PIDs, all idle in transaction, all with xact_age over four seconds. The ORM was opening a transaction, calling a payment provider over HTTP inside it, then committing. Every order touching the same inventory row queued behind the network call. The fix was in the application: move the HTTP call outside the transaction boundary. idle_in_transaction_session_timeout = '15s' went in as a guardrail so the next occurrence would be loud instead of slow.
Case 2: 70% IO:DataFileRead. Reporting endpoint against a 400M-row events table. EXPLAIN (ANALYZE, BUFFERS) showed 2.1M shared blocks read for a query returning 40 rows, an index scan on (tenant_id) followed by a filter on timestamp and event type. Built a composite index on (tenant_id, created_at DESC, event_type). The confirmation I trust more than the query timing: I reran the sampler afterward and the histogram flipped to mostly CPU/none with a thin tail of DataFileRead. The wait moved from storage to CPU, which is where work is supposed to happen.
Case 3: LWLock:WALInsert plus IO:WALSync, together, about 55% of samples. Nightly bulk load on an EBS gp2 volume, four hours and climbing. The instinct was to buy provisioned IOPS. The histogram said commit rate, not throughput: the loader was doing autocommit per row. Batching to 5,000 rows per transaction cut the load to 50 minutes. Raising max_wal_size to stop the checkpoint storm took another 12 minutes off. Storage stayed exactly the same.
Where wait events stop helping
There's no per-query attribution in core. You can see that 40% of your waits are DataFileRead, but tying that to a specific queryid needs pg_wait_sampling or a platform tool. There's no CPU breakdown either: NULL is a bucket, not a profile, and if the answer turns out to be CPU you need perf or a flamegraph, not pg_stat_activity.
Sampling misses anything shorter than your interval. A 20ms lock storm every 30 seconds is invisible at 1-second sampling and barely visible at 100ms.
Event names shift between major versions. The PG10 LWLock rename broke a lot of dashboards. Check the wait event tables for your specific version rather than trusting a blog post from 2017, including this one.
And if you're on RDS or Aurora, Performance Insights surfaces the same wait-event dimension, but Aurora reports engine-specific events (IO:XactSync, for one) that you will not find in community PostgreSQL documentation. Don't waste twenty minutes searching for a definition that isn't there.
If you'd rather have this running continuously than remember to start a sampler during an incident, MyDBA's free health check does the sampling and the aggregation for you and hands back the histogram, which is roughly what I'd do manually with the recipe above.
The 10-minute triage runbook
Paste this into your on-call doc.
- Sample. Run the
\watch 1one-liner immediately for a live read. If the incident will last more than two minutes, start the 100ms sampler intowait_samples. - Filter.
backend_type = 'client backend', exclude your own PID. Non-negotiable. - Aggregate. Run the histogram query. Read
avg_backends_waiting, not just the percentage. - Branch on the dominant type:
Lock→ run thepg_blocking_pids()query. Identify the blocker'sstateandxact_age. Fix the transaction shape, or terminate the blocker if it's a runaway.IO:DataFileRead→pg_stat_statementsordered byshared_blks_read, thenEXPLAIN (ANALYZE, BUFFERS)on the top offender. Index or plan problem until proven otherwise.IO:WALSync/IO:WALWrite→ count commits per second. Batch them. Considersynchronous_commitper-transaction. Checkmax_wal_sizeand checkpoint frequency.LWLock→ count backends. If over a few hundred, pool before you touch anything else.Client:ClientRead→ break down bystate. If it's allidle, the database is not your bottleneck; go look at the app. Ifidle in transactionshows up, that's your bug.CPU/none→ back toEXPLAINand plan work. Wait events have told you everything they can.
- Confirm the fix by resampling. A fix that doesn't move the histogram didn't fix anything.
Keep the sampler in a file. Keep the blocker query in the same file. The whole point is that when the page comes in, you're running SQL you've already debugged instead of writing new SQL at 3am. Postgres already told you what's wrong — sampling is just how you get it to speak in full sentences instead of a single freeze-frame.