Intuition is what gets you a two-hour outage. You "have a feeling" it's the connection pool, you bounce the app tier, it doesn't help, and now you've lost fifteen minutes plus whatever evidence was sitting in the app logs. The fastest path back is a fixed sequence run in a fixed order: disk, connections, OOM, WAL and archiving, then the log itself and, only at the very end, corruption.
📖 Read the full guide: Postgres Is Down: A 15-Minute Triage Runbook
▶ Watch the video walkthrough: Postgres is down: a first-15-minutes runbook
https://www.youtube.com/watch?v=Ok33WKX8GME
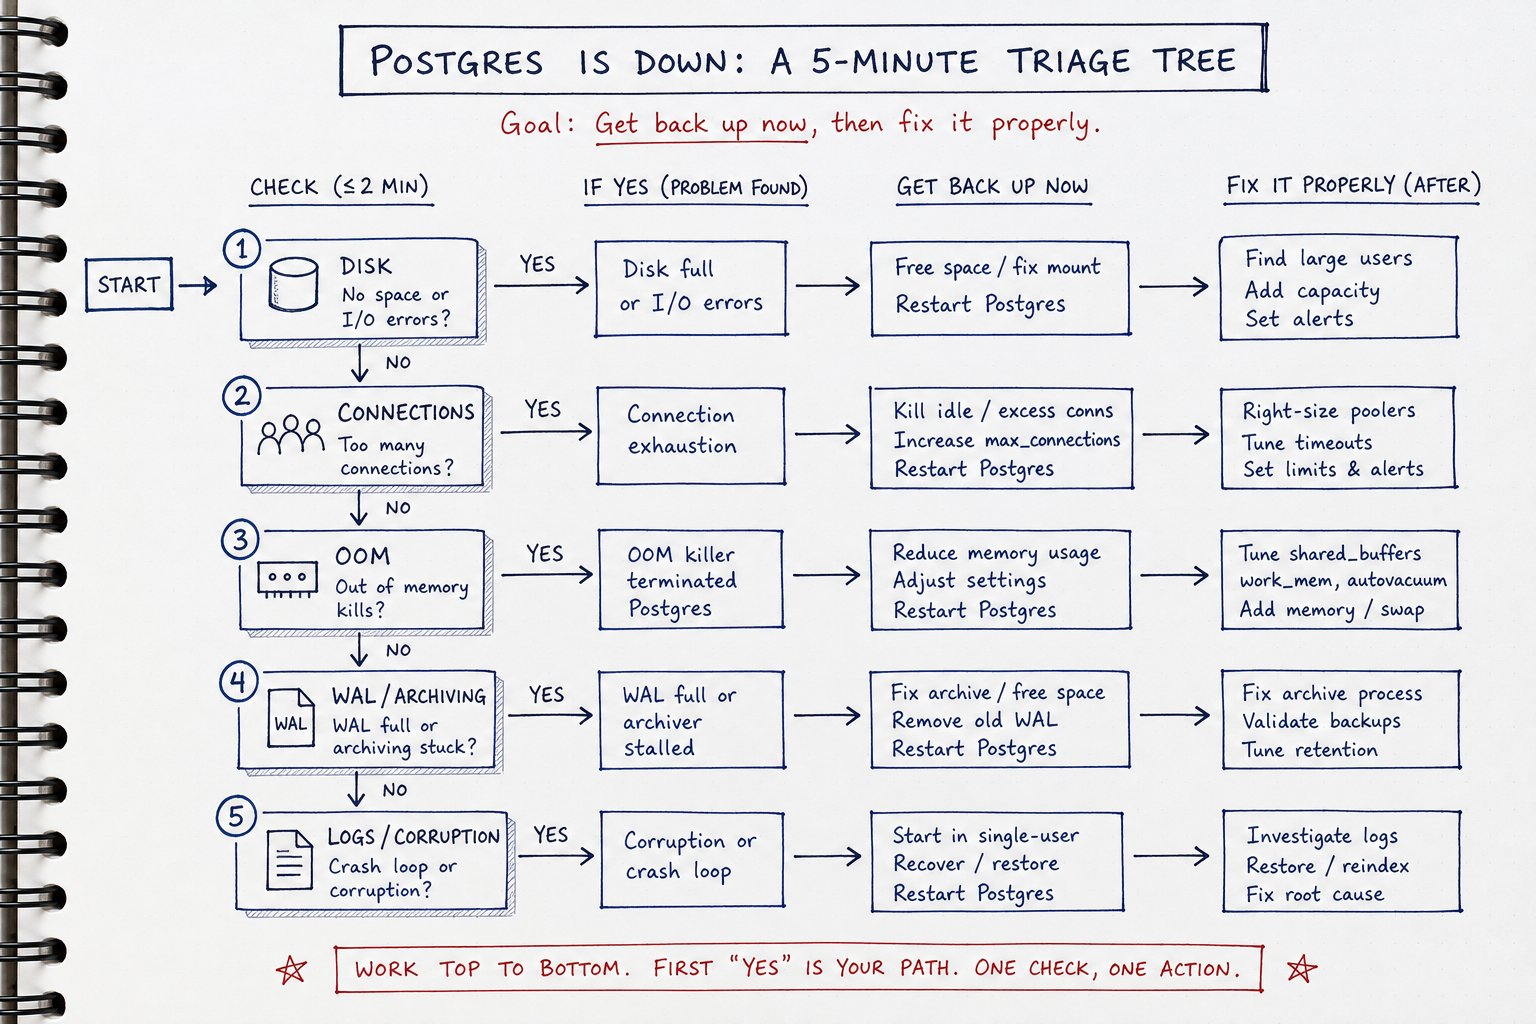
Each check eliminates an entire failure class in under two minutes. Each branch has two answers: the thing you do right now to get queries flowing, and the different thing you do afterwards to make it permanent. Confusing those two is how a 3am fix becomes a July incident report.
If you came here from the three-minute video version, this is the copy-paste companion. Bookmark it above the fold.
The first 60 seconds: don't touch anything yet
Before you type a single Postgres command, capture three things.
The exact time it stopped. Your monitoring, the app's first 5xx, whatever you have. You need this to correlate against cron, deploys, backup windows, and certificate expiries later.
Whether the host is even up. ping, then SSH. If SSH is refused too, the problem lives at the infrastructure layer — talk to whoever owns the hypervisor or the node pool instead of reading the rest of this.
The last 200 lines of the Postgres log.
tail -n 200 /var/log/postgresql/postgresql-*.log
Copy them somewhere off the box. Right now, before anything else touches the cluster.
Here is why the ordering matters. A blind systemctl restart postgresql that succeeds tells you almost nothing. The cluster comes up, everyone exhales, and you have no idea what killed it, which means you get to do this again in six hours. Worse: if the underlying cause is a full disk, the restart will crash-loop, and every loop dumps another wall of PANIC lines into the log, burying the first useful error under noise and consuming more of the disk you don't have. You'll have destroyed the evidence you need to fix this properly, and you'll have done it while the pager is still going off.
Restart last. Look first.
The triage tree at a glance
| # | Check | One command | Confirms it | Emergency action | Real fix |
|---|---|---|---|---|---|
| 1 | Disk full | df -h $PGDATA |
100% use; log says "No space left on device", PANIC | Delete non-Postgres junk; neutralise a blocking archive_command; checkpoint |
Fix archiving or the slot; capacity plan on runway |
| 2 | Connections | psql -c "select count(*) from pg_stat_activity" |
FATAL: sorry, too many clients already |
Terminate idle-in-transaction backends | pgBouncer in transaction mode; idle_in_transaction_session_timeout |
| 3 | OOM kill | dmesg -T | grep -i 'out of memory' |
"Out of memory: Killed process … postgres" | Restart, add swap | OOMScoreAdjust=-1000; lower work_mem; right-size RAM |
| 4 | WAL / archiving | select * from pg_stat_archiver |
failed_count climbing, last_failed_wal set |
archive_command='/bin/true' + reload, or drop the dead slot |
Fix the archive target; fresh base backup |
| 5 | Log / corruption | tail -200 the server log |
PANIC, "invalid page in block", wraparound refusal | Stop, snapshot the volume | Restore from backup |
The ordering is deliberate: cheapest and most common at the top, rarest and most destructive at the bottom. Disk is check 1 because it is both the single most frequent cause of an unplanned Postgres outage and the one that takes ten seconds to rule out. Connections are the next cheapest and most common. OOM requires digging into kernel logs, not Postgres's own, which takes a bit longer to correlate. WAL and archiving issues build quietly for days before they look like an outage. Corruption is check 5 because the recovery actions for it are irreversible, and you should never reach for them while a mundane explanation is still on the table.
If you already know your symptom, jump to that section. Otherwise run the tree top to bottom.
The five commands, in order
Mid-incident, on the box, as root or with sudo. Copy the whole thing.
# 1. Disk
df -h /var/lib/postgresql; du -sh /var/lib/postgresql/*/main/pg_wal

# 2. Connections (works even at max_connections if you're superuser)
psql -U postgres -c "select state, count(*) from pg_stat_activity group by 1 order by 2 desc;"

# 3. OOM killer
dmesg -T | grep -i -E 'out of memory|killed process' | tail -20

# 4. WAL and archiving
psql -U postgres -c "select archived_count, last_archived_wal, failed_count, last_failed_wal, last_failed_time from pg_stat_archiver;"
psql -U postgres -c "select slot_name, active, wal_status, safe_wal_size, restart_lsn from pg_replication_slots;"

# 5. The log
journalctl -u postgresql --no-pager -n 200 || tail -200 /var/log/postgresql/postgresql-*.log
Adjust the paths for your distribution. On RHEL-family it's /var/lib/pgsql/<version>/data.
If steps 2 and 4 fail because the server won't accept connections at all, that itself is information. Check pg_ctl status -D $PGDATA to see whether a postmaster is running, systemctl status postgresql for the unit state and the exit code, and then read the log from the very first line of the current startup attempt, not just the tail. A cluster that is running but refusing connections is a different problem from a cluster that is not running — this is the classic "postgresql not starting" scenario, and the log line, not a guess, tells you which one you have.
Check 1: is the data directory full? (postgres disk full pg_wal)
df -h $PGDATA
du -sh $PGDATA/pg_wal
du -sh --max-depth=1 $PGDATA/base | sort -h
At 100% you'll see log lines like:
ERROR:  could not write to file "pg_wal/xlogtemp.2841": No space left on device
PANIC:  could not write to file "pg_wal/xlogtemp.2841": No space left on device
LOG:  server process (PID 2841) was terminated by signal 6: Aborted
When the filesystem holding pg_wal fills completely, Postgres cannot write WAL, and it will PANIC and shut down rather than continue running in a state where it can't guarantee durability. That is documented behaviour, not a bug. It is also why the cluster crash-loops: it starts, tries to write, PANICs, systemd restarts it, repeat.
Three distinct situations hide behind "disk full", and they need different responses:
pg_walis the bulk of it. Almost always archiving or a replication slot. Go to check 4 while you're here.base/is the bulk of it. Real data growth, or bloat from failed autovacuum. Look at per-database sizes.- A shared mount is full and Postgres is collateral damage.
/varfilled with logs, a core dump, a forgotten tarball. This one is the easiest to miss, because you assume it's a Postgres problem and go straight to WAL commands when the fix isrmon an unrelated file.
One thing that trips people: df and du will disagree during an incident if a process is holding a deleted file open. Space isn't released until the descriptor closes. lsof +L1 will show you the culprit, and it's often a log rotation that ran while something still had the old file open. Don't chase the phantom discrepancy for twenty minutes — find the holder or move on.
Emergency actions, in strict order
- Delete non-Postgres junk first. Old log archives, core dumps, package caches, that 40GB
.tar.gzfrom the migration. Free space you can free without touching the cluster. - If
archive_commandis the blocker, setarchive_command = '/bin/true'and reload. This lets the checkpointer recycle WAL immediately. Read the consequences in check 4 before you do it. - Force a checkpoint and switch WAL once there's headroom:
SELECT pg_switch_wal();thenCHECKPOINT; - Never delete files from
pg_walby hand.
That fourth point is not a style preference. Removing a segment that has not been replayed or checkpointed past will break crash recovery and can leave you with a cluster that cannot start at all. The supported tool for pruning is pg_archivecleanup, and it operates on your archive directory, not on pg_wal. If you find yourself typing rm inside pg_wal, stop and go fix archiving instead. This is the one command on this entire tree you do not improvise.
Prevention worth ten minutes of your time: put a ballast file on the data volume. fallocate -l 10G $PGDATA/../BALLAST_DELETE_ME_IN_EMERGENCY. When you hit 100% at 3am, deleting it buys you the working room to run a checkpoint and think clearly. Cheapest insurance in the business.
Check 2: postgres too many connections fix
First, separate "the server is down" from "the server is up and refusing me". If your app is logging:
FATAL: sorry, too many clients already
the server is fine. It's saturated.
You can usually still get in as a superuser, because superuser_reserved_connections holds back slots specifically for this. That is the whole reason your alerting and your break-glass credentials should use a superuser role rather than the app role. On PostgreSQL 16 and later you also have reserved_connections plus the pg_use_reserved_connections role, so you can grant a non-superuser monitoring role its own reserved pool without handing out superuser for on-call. Do that.
Census first:
SELECT
  state,
  application_name,
  count(*) AS conns,
  max(now() - state_change) AS oldest
FROM pg_stat_activity
WHERE backend_type = 'client backend'
GROUP BY 1, 2
ORDER BY conns DESC;
Compare the total to SHOW max_connections;. If idle in transaction is a large share, you've found it. Something opened a transaction and wandered off, usually an ORM that forgot to commit or an app node that lost its network path mid-transaction.
Emergency reclaim:
SELECT pg_terminate_backend(pid), usename, application_name, now() - state_change AS idle_for
FROM pg_stat_activity
WHERE state = 'idle in transaction'
  AND state_change < now() - interval '10 minutes'
  AND pid <> pg_backend_pid();
Use pg_terminate_backend, not pg_cancel_backend. Cancel only kills the current query and leaves the session connected, which does nothing for you when the problem is that sessions are sitting idle holding slots. Terminate sends SIGTERM and actually closes the connection.
Raising max_connections is almost never the right first move. It requires a full restart, so you're taking a second outage during an incident. Every connection is a backend process with its own memory overhead, so you're also making an OOM kill more likely, which is check 3. And it treats the symptom: something is leaking sessions, and giving it more sessions to leak buys you hours, not a fix.
The real fix is pgBouncer in transaction pooling mode, so a few thousand client connections multiplex onto a few dozen server connections, plus idle_in_transaction_session_timeout set to something like 60 seconds so the pattern can't recur. That timeout is a reload, not a restart.
Check 3: postgres OOM killer postmaster
Postgres does not log its own OOM death, because it didn't do the killing. The kernel did.
dmesg -T | grep -i -E 'out of memory|killed process'
journalctl -k --since "1 hour ago" | grep -i oom
grep -i 'out of memory' /var/log/syslog
You're looking for something in the shape of:
[Wed Jul 8 03:14:22 2026] Out of memory: Killed process 2841 (postgres) total-vm:8912344kB, anon-rss:7742108kB
Correlate the PID against the Postgres log. Two very different outcomes:
- The postmaster was killed. The whole cluster stops, abruptly, no clean shutdown. Nothing restarts it except systemd or you.
- A child backend was killed. The postmaster sees a backend exit on signal 9, treats it as a crash, logs "terminating any other active server processes", forces everyone else out, and runs crash recovery. The cluster comes back on its own after a downtime measured in seconds to minutes. The visible symptom is a brief total outage that "fixed itself", which is exactly the kind of thing people ignore until it happens during peak.
Root causes, in the order I actually find them: work_mem too high multiplied by concurrency; shared_buffers set to a number someone read in a blog post that assumed a much larger machine; one runaway hash join over a table that grew past the planner's assumptions; and a container host with no swap at all, so there's no slack whatsoever.
The work_mem one deserves emphasis, because the parameter is widely misunderstood. It is a per-sort and per-hash-node allocation, not a per-connection cap. A single query with several sorts and hashes can allocate multiple times work_mem on its own. Multiply by concurrency and it's easy to write a config that is fine at 20 sessions and fatal at 200.
Emergency: restart, add swap if there is none. On a database server, swap is a safety valve that turns a kill into a slowdown you can page on, nothing fancier. It won't fix a genuine leak, but it buys you time instead of an instant kill.
Real fix: set OOMScoreAdjust=-1000 in the systemd unit for the postmaster, which is exactly what the Postgres docs recommend, so the kernel kills child backends in preference to the parent. This is the single highest-leverage change on this list. Then lower work_mem globally and raise it per-role for the reporting user who actually needs it (ALTER ROLE analytics SET work_mem = '256MB'). The vm.overcommit_memory=2 argument gets relitigated on every mailing list thread — it trades OOM-kill risk for allocation-failure risk — and my position is that strict overcommit on a dedicated database host is defensible, while on a mixed-workload host it will bite you in ways that are harder to diagnose than the OOM kills you were trying to avoid.
Check 4: postgres archive_command failing (the slow-motion outage)
This is the one that takes a cluster down at 3am after quietly building for a week.
SELECT archived_count, last_archived_wal, last_archived_time,
       failed_count, last_failed_wal, last_failed_time, stats_reset
FROM pg_stat_archiver;

SELECT slot_name, slot_type, active, wal_status, safe_wal_size,
       restart_lsn, pg_size_pretty(
         pg_wal_lsn_diff(pg_current_wal_lsn(), restart_lsn)) AS retained
FROM pg_replication_slots
ORDER BY retained DESC;
pg_stat_archiver is the fastest confirmation you will get. If failed_count is large, last_failed_time is recent, and last_archived_time is hours or days stale, archiving is stuck and that is your disk-full cause.
Why it kills you: with archive_mode on, WAL segments cannot be removed or recycled until they have been archived successfully. The archive_command contract is that it returns non-zero on failure, and Postgres then retains the segment and retries forever. Break the command, and pg_wal grows without bound at exactly the rate your workload generates WAL.
The second retention killer is an inactive replication slot. A slot that exists but has no consumer pins restart_lsn in place and holds every segment after it. A decommissioned replica whose slot was never dropped will fill your disk on a schedule. On PostgreSQL 13 and later, max_slot_wal_keep_size caps this: slots that exceed it get invalidated, and wal_status will show reserved, extended, unreserved or lost. Set it. A lost slot means rebuilding a replica; an unbounded slot means an outage.
Test the command by hand as the postgres user before you conclude anything:
sudo -u postgres bash -c '/usr/bin/pgbackrest --stanza=main archive-push \
  /var/lib/postgresql/16/main/pg_wal/000000010000000A000000B7; echo "exit=$?"'
If that doesn't return 0, that's your failing command, full stop.
Real causes I have actually seen, roughly by frequency: expired or rotated S3 credentials, a bucket quota returning 403, the archive volume itself being full, clock skew breaking request signing, and a cron-driven cleanup job that stopped running after a host rebuild.
Emergency versus real fix
Emergency: ALTER SYSTEM SET archive_command = '/bin/true'; then SELECT pg_reload_conf();, then SELECT pg_switch_wal(); and CHECKPOINT; to force the current partial segment out and confirm recycling resumes. Or drop the dead slot with SELECT pg_drop_replication_slot('old_replica');.
Be blunt with yourself about what you just did. /bin/true tells Postgres every segment was archived safely when none of them were. Your point-in-time recovery chain is broken from that moment. A fresh full base backup is mandatory, and it is mandatory today, not on Friday. Dropping a slot means the replica behind it can no longer catch up and must be rebuilt from a new basebackup.
Note the reload/restart split, because it matters when you're deciding whether you can afford to do it: archive_command is SIGHUP context and takes effect on reload. archive_mode is postmaster context and needs a full restart. So does max_connections. If you're already crash-looping, a restart costs nothing. If the cluster is up and serving, it costs an outage.
War story one: 318GB of WAL and a 403
July 2026. Postgres crash-looping, data volume at 100%, pg_wal at roughly 318GB. The pgBackRest archive_command had been failing for days. First instinct on the call was a broken stanza config, which is where most people would spend an hour.
Restore path was archive_command = '/bin/true', reload, checkpoint, and the checkpointer chewed through the backlog. Service back. Then the fresh full backup, immediately, because the PITR chain was gone.
The actual root cause was not the stanza at all. The S3-compatible bucket had blown past its 250GB quota and was returning 403 QuotaExceeded on every push. The archive command was doing exactly what it was designed to do: report failure and let Postgres retain the segment.
War story two: the bug was three layers upstream
Follow-on investigation in the same environment, root cause confirmed a few weeks later. A host move had left a PostGIS shared library missing. Autovacuum was failing cluster-wide as a result, and had been for about 19 days. One table bloated to roughly 177GB. That bloat inflated every full and differential backup and pushed WAL volume up, which is what filled the bucket in the first place.
So the chain was: missing .so file, then broken autovacuum, then table bloat, then oversized backups and WAL, then bucket quota exceeded, then archiving failure, then pg_wal growth, then disk full, then crash loop.
The disk-full alert was the correct symptom and the wrong layer — three layers downstream of the actual bug. That is the normal case, not the exception. Chasing the alert alone would have fixed the outage and left the real bug running for another 19 days. Fix the outage with the triage tree, then keep pulling the thread until you reach something that is a bug rather than a consequence.
Check 5: postgres crash recovery runbook (log, then corruption)
Find the log. SHOW log_directory; and SHOW log_filename; if you can connect. Otherwise journalctl -u postgresql, or container stdout via docker logs / kubectl logs. On Debian-family the default is /var/log/postgresql/.
| Log message | Likely cause | Next command |
|---|---|---|
PANIC: could not write to file ... No space left on device |
Disk full, usually WAL | df -h $PGDATA; du -sh $PGDATA/pg_wal |
FATAL: sorry, too many clients already |
Connection saturation, server is up | pg_stat_activity census (check 2) |
server process was terminated by signal 9: Killed |
Kernel OOM killer | dmesg -T | grep -i 'out of memory' |
could not locate a valid checkpoint record |
Damaged or truncated WAL, or hand-deleted segments | Stop. Snapshot the volume. Get your backup. |
invalid page in block N of relation base/... |
Page-level corruption, often storage | Snapshot, then restore from backup |
database system was not properly shut down; automatic recovery in progress |
Normal crash recovery after an unclean stop | Wait it out, then find what caused the unclean stop |
database is not accepting commands to avoid wraparound data loss |
Transaction ID wraparound protection | VACUUM the oldest database; see below |
Two of those need spelling out.
Crash recovery is not an error. After an unclean shutdown Postgres replays WAL from the last checkpoint before accepting connections. On a busy cluster with large max_wal_size this can take minutes. Let it finish. Killing it and restarting only makes it start over.
Wraparound looks like an outage but is a refusal to write. The server is running and will answer read queries, but it will not assign new transaction IDs. This is deliberate protection against data loss, not failure. The fix is vacuuming the databases with the oldest datfrozenxid; in the worst case you stop the server and run VACUUM in single-user mode. Check the situation with:
SELECT datname, age(datfrozenxid) AS xid_age
FROM pg_database ORDER BY xid_age DESC;
If you got here through a failed autovacuum, see war story two. It rhymes.
Corruption. If the log shows invalid pages or a missing checkpoint record, do three things in this order: stop the cluster, snapshot the volume, and locate a verified backup. What you do not do is reach for pg_resetwal or zero_damaged_pages first. pg_resetwal is documented as a last resort for a server that will not start, it can cause data loss, and it can leave the cluster inconsistent in ways that surface weeks later. The docs tell you to take a filesystem-level backup of the data directory before running it, and that instruction is not decorative. zero_damaged_pages does exactly what the name says: it discards the damaged data. Both are recovery-of-last-resort tools for when you have no backup, and both require a copy of the broken cluster first so you can try again differently.
The two things you do after it's back up
Every emergency action above is debt. It buys you uptime and creates a follow-up obligation, and skipping the follow-up is how the next incident gets worse. Write these down before you go back to sleep.
| Emergency action taken | Permanent follow-up | Deadline |
|---|---|---|
archive_command = '/bin/true' |
Fix the archive target, restore the real command, take a fresh full backup, verify it restores | Same day |
| Dropped a replication slot | Rebuild the replica from a new basebackup | Same day |
| Terminated idle-in-transaction sessions | Deploy pgBouncer; set idle_in_transaction_session_timeout; find the app that leaks |
This week |
| Added swap | Right-size RAM or lower work_mem; set OOMScoreAdjust=-1000 |
This week |
| Deleted the ballast file | Recreate it | Same day |
Raised max_connections under pressure |
Pool properly, then put it back | This week |
Then write the incident note while it's fresh. Timeline with real timestamps, the log lines you saw, the command that confirmed the cause, the command that restored service, and the open debt items with names against them. Twenty minutes now, versus reconstructing it from Slack scrollback in three weeks when someone asks why the backup chain has a gap. The note is what turns this into a runbook instead of a repeat page.
Make the next one a non-event
Every branch in this tree has a leading indicator that would have fired days earlier.
Disk runway, not percent used. A static 80% threshold is useless for WAL incidents, because once archiving breaks, growth is near-linear and you can go from 60% to 100% in hours. Alert on days-to-full computed from a recent growth rate. "Seven days of runway at the current rate" is actionable at 10am. "82% used" is noise — it doesn't tell you if you have six hours or six days.
pg_wal directory size as a trend. Not a threshold, a slope. A healthy cluster's pg_wal oscillates around a steady value. A cluster with broken archiving climbs monotonically, and that shape is visible long before the disk cares.
pg_stat_archiver.failed_count > 0. Any non-zero value, alert on it, checked on a schedule rather than discovered mid-outage. It is the single highest signal-to-noise check in Postgres monitoring. In war story one it would have fired days before the crash loop.
Connection saturation as a percentage of max_connections. Alert at 80%, not on the FATAL message and not just a binary up/down check. By the time you see "too many clients already" in the app log, users are already getting errors.
Getting all four in place is a day of work if you already have a metrics stack, and if you'd rather not build it, MyDBA's free health check reports on exactly this class of leading indicator (https://mydba.dev/?utm_source=wordpress&utm_medium=platform&utm_campaign=postgres-is-down-triage-tree). Either way, the four checks matter more than the tool.
The printable version
Stick this above the desk:
POSTGRES IS DOWN
  0. Note the time. Check SSH. Save the last 200 log lines.
  1. df -h $PGDATA          -> full?    free junk, /bin/true, checkpoint. NEVER rm pg_wal.
  2. pg_stat_activity       -> full?    terminate idle-in-transaction. Do not raise max_connections.
  3. dmesg -T | grep -i oom -> killed?  restart, swap, OOMScoreAdjust=-1000
  4. pg_stat_archiver       -> failing? /bin/true + reload, then FRESH BACKUP TODAY
     pg_replication_slots   -> inactive slot? drop it, then rebuild the replica
  5. the log                -> PANIC / invalid page / wraparound: stop, snapshot, restore
  RELOAD: archive_command, idle_in_transaction_session_timeout
  RESTART: archive_mode, max_connections, shared_buffers
Run it in order. The order is the whole point.
Speed is a discipline, not a talent
Nobody handles a Postgres outage well by instinct the first time. The people who look calm at 3am aren't calmer than you — they've run this exact sequence enough times that skipping straight to the log, then disk, then connections, is muscle memory instead of a decision. That's the whole point of writing it down: it turns a stressful judgment call into a checklist you can execute half-asleep, in order, without arguing with yourself about what to try next. Print it, tape it up, and the next outage costs you minutes instead of hours.