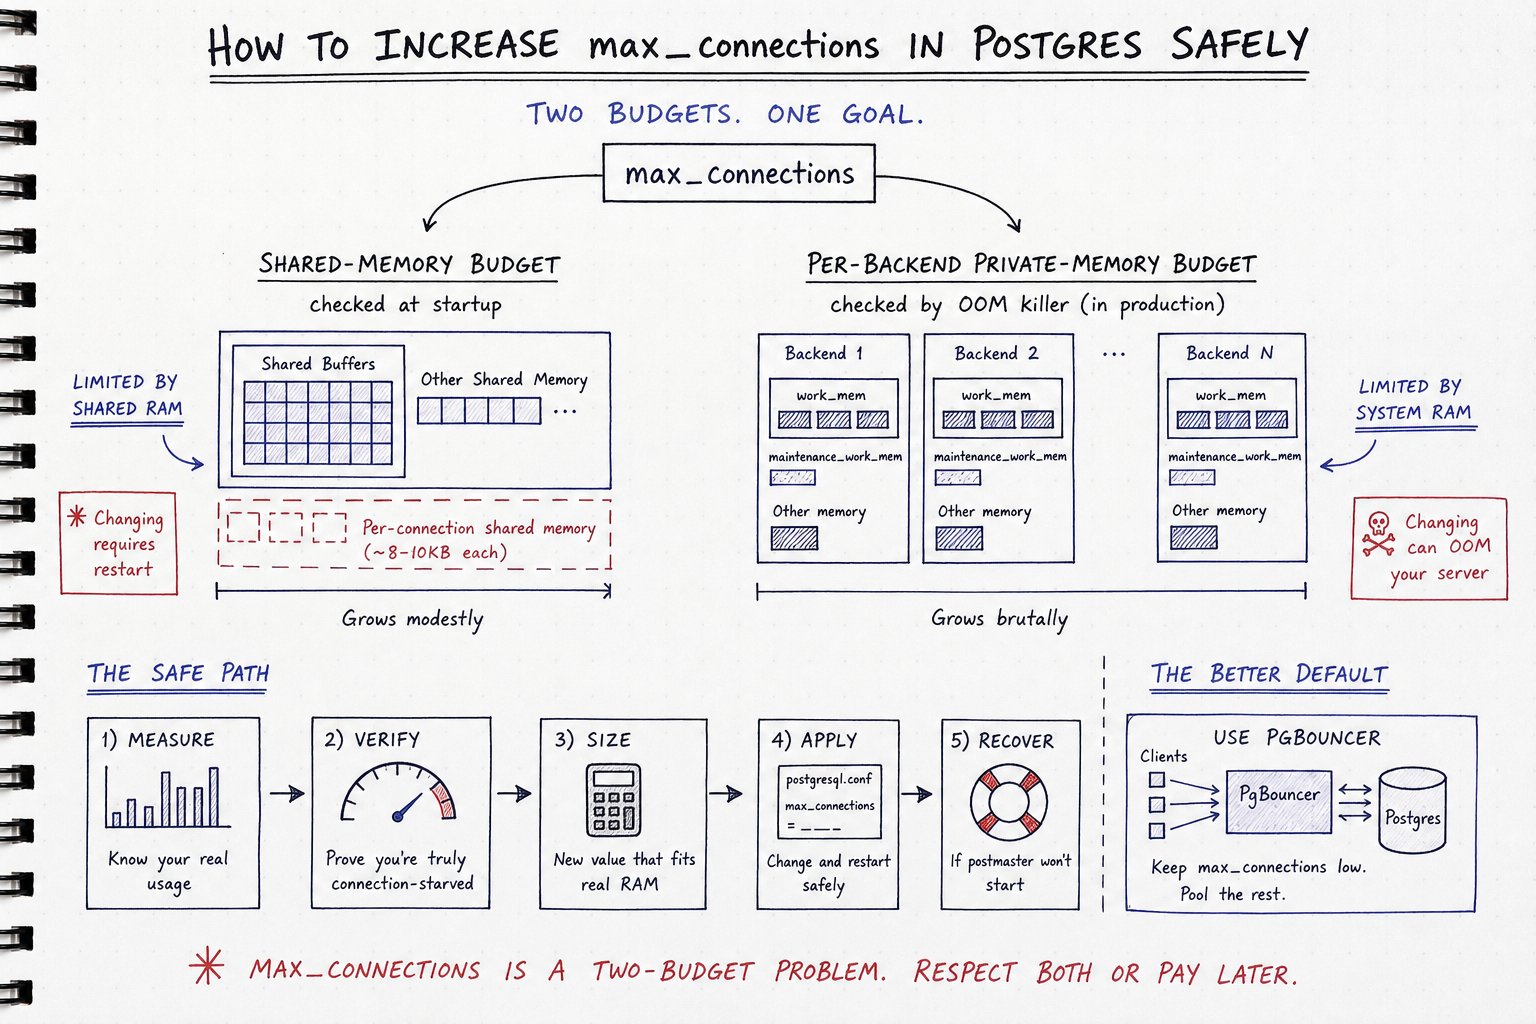
To increase max_connections in Postgres, run ALTER SYSTEM SET max_connections = N; (or edit postgresql.conf) and restart the server — a reload alone won't apply it, because max_connections is a postmaster-context parameter read once at startup. That's the easy part. The part that bites you three days later is sizing that number against real RAM, because every extra slot adds private backend memory that Postgres never checks against your available memory. The Linux OOM killer checks it for you, usually on a Tuesday afternoon.
📖 Read the full guide: max_connections in Postgres: A Memory Decision in Disguise
▶ Watch the video walkthrough: How to Check and Safely Raise max_connections in Postgres
https://www.youtube.com/watch?v=I4kvuC-8F9g
Someone opened a ticket: "we need more connections." Maybe the app is throwing FATAL: sorry, too many clients already in a loop, maybe a dashboard turned red. The fix looks like one line in a config file. It isn't.
Here's the decision tree, in three steps:
- Measure what you actually use — peak client backends over time, not a point-in-time count, and not
SELECT count(*) FROM pg_stat_activity. - Try a pooler. PgBouncer in transaction mode solves the problem roughly nine times out of ten, without a restart window.
- Only then raise the number, sized against real RAM, with
work_memadjusted in the same change.
This walkthrough covers the exact SQL, the memory arithmetic, the kernel prerequisites, and the recovery drill for when the postmaster refuses to come back up.
What max_connections actually reserves
max_connections is an upper bound on concurrent backend processes. The default is 100 in a stock install, though initdb picks something lower if the platform can't support 100.
Its context is postmaster. Confirm it yourself:
SELECT context FROM pg_settings WHERE name = 'max_connections';
postmaster context means the value is read once, at server start. pg_reload_conf() or a SIGHUP won't touch it. Edit the config and reload, and Postgres accepts the edit, logs that it's ignoring the new value because it requires a restart, and keeps running on the old number until you actually restart the process.
The reason is structural: Postgres allocates fixed-length arrays in shared memory at startup, and max_connections sizes several of them. The PGPROC array gets one slot per possible backend. The shared lock table is sized roughly by max_locks_per_transaction × (max_connections + max_prepared_transactions). The predicate lock table scales similarly. You can't grow a fixed-size shared-memory array while processes are attached to it — so you restart.
The other thing to internalize before you do arithmetic: the number you SHOW is not the number of slots your application can use.
superuser_reserved_connectionsdefaults to 3, held back for superusers.- PostgreSQL 16 added
reserved_connections(default 0), whose slots go to roles grantedpg_use_reserved_connections.
So the usable count is:
usable_slots = max_connections - superuser_reserved_connections - reserved_connections
On a default PG 15 install that's 97, not 100. On PG 16+ with reserved_connections = 10, it's 87. Small numbers, but they're exactly the numbers you're short by when you're being paged.
Step 1: check what you have and what you're actually using
Where the current value came from
On a server that's been through three ops teams, this matters:
SELECT name, setting, unit, context, source, sourcefile, sourceline
FROM pg_settings
WHERE name IN ('max_connections', 'work_mem', 'shared_buffers');
source tells you default, configuration file, or command line. sourcefile and sourceline tell you which file and which line — how you discover someone set work_mem in postgresql.auto.conf two years ago and nobody knew.
Count real client connections
SELECT state,
       count(*) AS conns
FROM pg_stat_activity
WHERE backend_type = 'client backend'
GROUP BY state
ORDER BY conns DESC;
Don't use SELECT count(*) FROM pg_stat_activity. Since 9.6 that view includes non-client processes: autovacuum workers, the walwriter, checkpointer, background workers, logical replication workers. backend_type exists to filter them out. Skip the filter and you'll over-count — on a busy box with parallel query, by a lot. Teams have raised max_connections because of a number that included eight parallel workers and the checkpointer.
Break it down by who's responsible:
SELECT application_name,
       usename,
       state,
       count(*)
FROM pg_stat_activity
WHERE backend_type = 'client backend'
GROUP BY 1, 2, 3
ORDER BY 4 DESC
LIMIT 20;
And the usable-slots check:
SELECT current_setting('max_connections')::int
     - current_setting('superuser_reserved_connections')::int
     - COALESCE(current_setting('reserved_connections', true)::int, 0)
       AS usable_slots;
(The true argument lets it tolerate the parameter not existing on pre-16 servers.)
A single reading proves nothing. You need the peak.
Step 2: prove you're actually connection-starved
"High connection count" and "hitting the wall" are different problems with different fixes.
Check the log for the actual error
Hitting the wall leaves evidence. The exact string:
FATAL: sorry, too many clients already
Grep for it with a per-day count, so you know if this is chronic or a single bad deploy:
grep -c 'sorry, too many clients already' /var/log/postgresql/postgresql-*.log

# with timestamps, to see the shape of it
grep 'sorry, too many clients already' /var/log/postgresql/postgresql-*.log \
  | awk '{print $1, $2}' | sort | uniq -c
No hits? You're not connection-starved. You have a monitoring threshold firing at 70% of a number someone picked in 2019.
Sample the real high-water mark
If you have pg_cron:
CREATE TABLE conn_samples (
  ts            timestamptz NOT NULL DEFAULT now(),
  total         int NOT NULL,
  active        int NOT NULL,
  idle          int NOT NULL,
  idle_in_txn   int NOT NULL
);

CREATE OR REPLACE FUNCTION sample_conns() RETURNS void LANGUAGE sql AS $$
  INSERT INTO conn_samples (total, active, idle, idle_in_txn)
  SELECT count(*),
         count(*) FILTER (WHERE state = 'active'),
         count(*) FILTER (WHERE state = 'idle'),
         count(*) FILTER (WHERE state = 'idle in transaction')
  FROM pg_stat_activity
  WHERE backend_type = 'client backend';
$$;

SELECT cron.schedule('conn-sample', '* * * * *', 'SELECT sample_conns()');
No pg_cron? A crontab line does the same job:
* * * * * psql -qAtX -d postgres -c "SELECT sample_conns()" >/dev/null 2>&1
Let it run for a week that includes a Monday morning and a month-end batch. Then:
SELECT max(total)       AS peak_total,
       max(active)      AS peak_active,
       max(idle_in_txn) AS peak_idle_in_txn,
       percentile_disc(0.99) WITHIN GROUP (ORDER BY total) AS p99_total
FROM conn_samples
WHERE ts > now() - interval '7 days';
Read the split. If peak_active is 30 and peak_total is 480, you don't have a capacity problem — you have 450 backends sitting there holding a PGPROC slot and private memory to do nothing.
The idle-in-transaction trap
Most "we need more connections" tickets are idle-in-transaction bugs or a missing pooler. A wall of idle in transaction means application code opened a transaction, went off to call an HTTP API, and came back forty seconds later. That's a code bug wearing a config-change costume. Two immediate pressure valves:
ALTER SYSTEM SET idle_in_transaction_session_timeout = '60s';  -- PG 9.6+
ALTER SYSTEM SET idle_session_timeout = '30min';               -- PG 14+
SELECT pg_reload_conf();
Both are reloadable, unlike the setting you came here to change. Start generous and tighten. Set per-role if a batch job legitimately holds long transactions.
One more data point: PostgreSQL 14 substantially improved the scalability of computing MVCC snapshots so the cost tracks active transactions rather than total connections. Idle connections got cheaper on 14+. They did not become free.
The two budgets: shared memory vs. private memory
Budget one: shared memory. Each additional slot adds a modest, fixed amount — PGPROC entry, lock table slots, predicate lock slots, a few per-backend arrays. Measure it exactly rather than guessing. On PG 13+:
SELECT name, pg_size_pretty(size) AS size
FROM pg_shmem_allocations
ORDER BY size DESC
LIMIT 15;
Record that on the current setting, restart with the new one, run it again, diff. That's your real shared-memory cost, in bytes, on your build.
Since 9.3, Postgres uses mmap-based POSIX shared memory for the bulk of its allocation, so the old SHMMAX/SHMALL tuning is generally unnecessary on Linux. If shared memory doesn't fit, the postmaster refuses to start and says so in the log. That's the good failure — loud, immediate, and it happens during your maintenance window while you're watching.
Budget two: per-backend private memory. Postgres uses one OS process per connection. Each backend gets its own private memory for query execution, catalog caches, and plan caches. Nothing in Postgres validates that max_connections × realistic-per-backend-memory fits in RAM. Nothing warns you. The Linux OOM killer performs that check, in production, three days after your change.
RSS from ps overstates per-backend usage badly, because every shared_buffers page a backend has touched counts in its RSS. On a box with 8 GB of shared buffers, backends will appear to "use" 2 GB each. Use Pss from smaps_rollup instead, which apportions shared pages across the processes mapping them:
# one backend
grep -E '^(Rss|Pss)' /proc/12345/smaps_rollup

# every backend, sorted
for p in $(pgrep -f 'postgres.*client backend|postgres:'); do
  pss=$(awk '/^Pss:/ {print $2}' /proc/$p/smaps_rollup 2>/dev/null)
  [ -n "$pss" ] && echo "$pss $p"
done | sort -rn | head -20
Values are in kB. Take the median and the 95th percentile. The median is your steady-state per-backend cost; p95 shows what a working backend looks like. These numbers are specific to your schema, driver, and query mix — anyone quoting a universal "backends use N MB" figure is guessing.
The work_mem multiplication trap
work_mem is not per connection. It's not per query. It's per operation.
A single plan with three sorts and two hash joins can allocate work_mem five times over in one backend. Hash-based nodes get work_mem × hash_mem_multiplier, added in PG 13 and raised from a default of 1.0 to 2.0 in PG 15. So on a modern version, a hash node may take double what you configured. Each parallel worker gets its own allowance too, multiplying further.
Worst-case arithmetic at work_mem = 4MB, assuming a heavy backend runs two sorts and two hash nodes (4 + 4 + 8 + 8 = 24 MB), no parallelism:
| max_connections | Worst-case work_mem total | At 3 parallel workers each |
|---|---|---|
| 100 | 2.4 GB | 9.6 GB |
| 200 | 4.8 GB | 19.2 GB |
| 500 | 12.0 GB | 48.0 GB |
Worst case isn't the expected case — most backends are idle or running index lookups that allocate nothing. That's why you monitor available memory rather than trusting a spreadsheet. But look at the 500-connection row: on a 32 GB box, one bad reporting query fanned out across the pool takes the machine down.
The surgical alternative to a global bump, in either direction:
ALTER ROLE analytics SET work_mem = '256MB';
ALTER ROLE app_rw   SET work_mem = '4MB';
ALTER DATABASE reporting SET work_mem = '128MB';
Now the OLTP pool stays cheap, and the two analysts who need a big sort get one — without every connection carrying the risk.
Try the pooler first
PgBouncer in transaction pooling mode puts thousands of client connections in front of a small server pool. A minimal config:
[databases]
appdb = host=127.0.0.1 port=5432 dbname=appdb

[pgbouncer]
listen_addr = 127.0.0.1
listen_port = 6432
auth_type = scram-sha-256
auth_file = /etc/pgbouncer/userlist.txt

pool_mode = transaction
max_client_conn = 2000      ; default is 100
default_pool_size = 25      ; default is 20
reserve_pool_size = 5
server_idle_timeout = 600

max_prepared_statements = 200   ; PgBouncer 1.21+
Two defaults people forget: max_client_conn defaults to 100 and default_pool_size defaults to 20. Leave max_client_conn at 100 and you've just relocated your connection wall from Postgres to PgBouncer — now you get to debug it in two places.
What transaction pooling breaks
Because the server connection is only yours for the duration of a transaction:
- Session-level
SET(useSET LOCALinside a transaction instead) - Advisory locks held across transactions
LISTEN/NOTIFYWITH HOLDcursors- Anything else assuming the same backend answers your next statement
Named prepared statements used to be on that list. PgBouncer 1.21 added protocol-level support via max_prepared_statements, removing a long-standing blocker for JDBC, asyncpg and friends. Check your version before assuming either way.
When PgBouncer isn't the answer
Long-running analytics sessions gain nothing from transaction pooling because each session holds a server connection for minutes anyway. Apps that genuinely need session state (temp tables across statements, LISTEN) need session pooling, which doesn't multiplex. And if your app framework already pools well and pools are correctly sized, adding PgBouncer just adds a hop and an outage surface without changing the arithmetic. In those cases, raising max_connections is the right call — just do the rest of this article first.
Step 3: size the new number against real RAM
Worked example: a dedicated 32 GB instance, PG 16, OLTP with a bit of reporting.
Total RAM                                        32.0 GB
- OS, page cache headroom, monitoring agents      -2.0 GB
- shared_buffers (8 GB)                           -8.0 GB
- maintenance_work_mem 1 GB × autovacuum_max_workers 3   -3.0 GB
- headroom for one manual REINDEX/VACUUM          -1.0 GB
================================================  =======
Available for backend private memory             18.0 GB
From smaps_rollup, say median backend Pss is 12 MB and p95 is 40 MB. At 300 connections, steady state is roughly 3.6 GB. Add the work_mem worst case: at work_mem = 4MB and 24 MB per heavy backend, 300 × 24 MB = 7.2 GB if every backend simultaneously ran a four-node plan — which won't happen, but is the number you're insuring against. Total worst case: around 11 GB against 18 GB available. That fits with room to spare.
At 500 connections, the same arithmetic gives 12 GB of work_mem alone plus 6 GB baseline — you're at the edge. So 300 is defensible on this box; 500 needs a change elsewhere.
Three levers when it doesn't fit:
- Add RAM — usually the cheapest option in the cloud.
- Lower
work_memglobally and grant a larger value per-role where needed. - Accept that a pooler was the answer and stop trying to make the number work.
The classic OOM setup: raising max_connections from 100 to 400 while leaving work_mem at 64 MB because someone tuned it for a nightly report. That quadruples the multiplier on a value that was already aggressive. If you change the connection count and don't touch work_mem, you should be able to explain why.
Step 4: kernel prerequisites before you restart
Semaphores. SysV semaphores still scale with max_connections. The documented minimum:
SEMMNI >= ceil((max_connections + autovacuum_max_workers
                + max_wal_senders + max_worker_processes + 5) / 16)
SEMMNS >= SEMMNI * 17
Check and set:
ipcs -ls
sysctl kernel.sem            # SEMMSL SEMMNS SEMOPM SEMMNI
# persist in /etc/sysctl.d/60-postgres.conf, then sysctl --system
File descriptors. Each backend opens files. Check max_files_per_process in Postgres, the process limit (ulimit -n for the postgres user, or LimitNOFILE in the systemd unit), and fs.file-max system-wide.
Huge pages. If huge_pages = on and the kernel doesn't have enough pre-allocated huge pages for the now-larger shared memory request, the server refuses to start. Recalculate vm.nr_hugepages before the restart, or set huge_pages = try to fall back to normal pages. Get the required size from postgres -C shared_memory_size_in_huge_pages -D $PGDATA on PG 15+.
Overcommit and the OOM killer. On Linux with default overcommit, the OOM killer can pick the postmaster, taking down every backend at once. The docs recommend adjusting the postmaster's oom_score_adj so a backend dies instead of the parent, with backends re-raising via PG_OOM_ADJUST_VALUE. On a dedicated database server, vm.overcommit_memory = 2 is worth considering, with vm.overcommit_ratio set deliberately.
Step 5: apply the change and watch the first restart
ALTER SYSTEM SET max_connections = 200;
Now restart — a reload will not do it. pg_reload_conf() returns t and changes nothing, and you'll spend twenty minutes wondering why SHOW still says 100.
ALTER SYSTEM writes to postgresql.auto.conf, which is read after postgresql.conf and therefore wins. If you prefer editing postgresql.conf directly, check that postgresql.auto.conf doesn't already contain the parameter, or your edit is dead on arrival.
sudo systemctl restart postgresql@16-main     # Debian/Ubuntu
sudo systemctl restart postgresql-16          # RHEL family
pg_ctl -D /var/lib/pgsql/16/data restart -m fast   # manual installs
Tail the log through startup. You want "database system is ready to accept connections" and nothing between it and the shutdown message.
Verify:
SHOW max_connections;

SELECT name, setting, source, sourcefile, sourceline
FROM pg_settings WHERE name = 'max_connections';

SELECT sum(size) AS total_shmem FROM pg_shmem_allocations;
Diff that last number against the pre-change value you recorded. Now you know the real shared-memory cost of the change instead of estimating it.
When Postgres won't start: the recovery drill
You can't ALTER SYSTEM your way out of a server that won't boot, because you need a running server to run SQL. That's the part nobody writes down, and it's why people panic.
Error strings to match on (wording varies slightly by platform and version):
FATAL:  could not map anonymous shared memory: Cannot allocate memory
HINT:  This error usually means that PostgreSQL's request for a shared
       memory segment exceeded available memory, swap space, or huge pages.

FATAL:  could not create semaphores: No space left on device
DETAIL:  Failed system call was semget(...).
The first points at RAM or huge pages. The second points at SEMMNI/SEMMNS.
Escape hatch one: edit the file. postgresql.auto.conf lives in the data directory. It's plain text with a "do not edit manually" header, which you're now going to ignore.
cd /var/lib/pgsql/16/data
cp postgresql.auto.conf postgresql.auto.conf.bak
sed -i "/^max_connections/d" postgresql.auto.conf
Start normally. Once you're up, use ALTER SYSTEM RESET max_connections; for the clean version.
Escape hatch two: override on the command line, which beats both config files.
pg_ctl -D /var/lib/pgsql/16/data start -o "-c max_connections=100"
# or directly
postgres -D /var/lib/pgsql/16/data -c max_connections=100
Use this when you want the server up right now and you'll sort out the config afterward. Keep both escape hatches tested in your runbook before you need them.
Max_connections on RDS and other managed Postgres
On Amazon RDS and Aurora PostgreSQL, the default parameter group sets:
max_connections = LEAST({DBInstanceClassMemory/9531392}, 5000)
It scales with instance class memory and caps at 5000 — meaning scaling the instance up changes your connection limit whether you asked for it or not.
max_connections is a static parameter on RDS. You change it in a custom parameter group, attach that group to the instance, and reboot. ALTER SYSTEM isn't available for it, and there's no reload path.
You also generally can't tune kernel semaphores or overcommit on managed platforms — two of the levers in this article are simply gone. That pushes the pooler answer harder: RDS Proxy if you want it managed, or PgBouncer on a small instance if you want transaction pooling with control over pool_mode and prepared statements.
The playbook, condensed
- Sample
pg_stat_activity(filtered onbackend_type = 'client backend') for a week. Record peak total, peak active, peak idle-in-transaction. - Grep the log for
FATAL: sorry, too many clients already. No hits means no capacity problem. - If idle-in-transaction is a meaningful share of peak, fix the application. Set
idle_in_transaction_session_timeoutandidle_session_timeouttoday. - Deploy PgBouncer in transaction mode. Raise
max_client_connoff its default of 100 and sizedefault_pool_sizeabove its default of 20. Confirm nothing in your app depends on session-scoped features. - If a pooler genuinely doesn't fit, measure per-backend Pss via
smaps_rollupand size the new value against real RAM. - Lower
work_memglobally, raise it per-role where needed. - Check
SEMMNI/SEMMNS, file descriptors, huge page count, and the postmaster'soom_score_adj. ALTER SYSTEM SET max_connections = N;then restart in a maintenance window — not a reload.- Verify with
SHOW,pg_settings, and apg_shmem_allocationsdiff. - Monitor available memory and OOM events for a week. Keep the recovery drill open in a tab for the first restart.
If you want a second opinion before touching the number, MyDBA's free health check (mydba.dev) flags no-pooler setups and returns RAM-aware suggestions for max_connections, shared_buffers, and work_mem together — which is the only way those three should ever be considered.