Postgres Replication Lag Is Four Numbers, Not One
The page comes in at 03:14: "replica is lagging." That sentence tells you nothing useful. Lagging where? Postgres doesn't have a lag counter. It has a pipeline with four measurable checkpoints, and the primary exposes all four side by side in pg_stat_replication. Know which gap is growing and you know whether to look at the network, the standby's disks, the startup process, or a long-running analytics query someone left open on the replica.
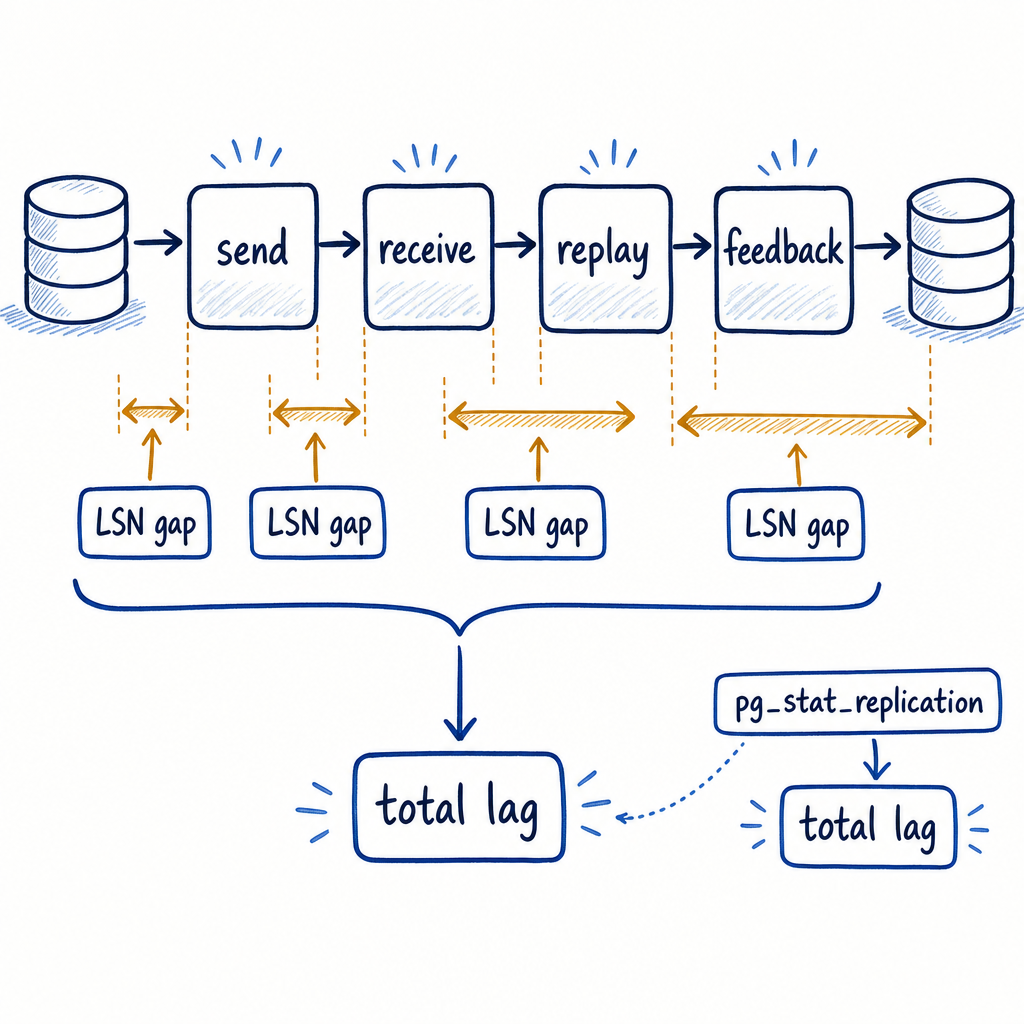
I recorded a video walkthrough that visualises the pipeline stage by stage if you want the diagram version first. This article is the deeper cut: the exact queries, the columns that matter, the failure signatures, and what to actually change.
The Pipeline: What Actually Happens Between Primary and Standby
Four stages, in order:
- Generate. A backend on the primary commits, WAL records land in the WAL buffers and then in
pg_wal.pg_current_wal_lsn()tells you the last write position,pg_current_wal_insert_lsn()the last insert position. - Send. A
walsenderprocess reads WAL and streams it to a connected standby. The furthest byte it has handed to the socket issent_lsn. - Receive. The standby's
walreceivertakes those bytes, writes them into its ownpg_wal(write_lsnfrom the primary's perspective), then fsyncs them (flush_lsn). - Replay. The standby's startup process reads that flushed WAL and applies it into the data files. That position is
replay_lsn.
Running alongside all of this is a feedback channel. The standby periodically sends a status message back to the primary containing its write, flush and replay positions with timestamps, and optionally its oldest transaction xmin (and catalog_xmin, for logical/catalog cases) if hot_standby_feedback is on. That message cadence is wal_receiver_status_interval, default 10 seconds.
That feedback message is where the *_lag interval columns come from. The primary piggybacks a send timestamp on outgoing WAL, the standby echoes it back once it has written, flushed and replayed that position, and the primary subtracts. So write_lag, flush_lag and replay_lag answer "how long ago", not "how many bytes behind." Two different questions with two different answers, and mixing them up is how people end up alerting on the wrong thing.
One consequence worth internalising: if you set wal_receiver_status_interval to something coarse like 60s to "reduce chatter," every lag interval column inherits that granularity. You will see lag quantised into ugly steps and wonder why the numbers look wrong.
Measuring Lag on the Primary: pg_stat_replication
Start here. One row per active WAL sender:
SELECT application_name, sent_lsn, write_lsn, flush_lsn, replay_lsn, write_lag, flush_lag, replay_lag FROM pg_stat_replication;
Sample output from a system that was genuinely unwell:
 application_name |  sent_lsn   |  write_lsn  |  flush_lsn  | replay_lsn  | write_lag | flush_lag | replay_lag
------------------+-------------+-------------+-------------+-------------+-----------+-----------+------------
 standby-a        | 6C/3A19F8C0 | 6C/3A19F8C0 | 6C/3A19F8C0 | 6C/2F004410 | 00:00:00.004 | 00:00:00.011 | 00:00:47.2
 standby-b        | 6C/3A19F8C0 | 6C/38A21000 | 6C/34110800 | 6C/34110800 | 00:00:00.4  | 00:00:02.3   | 00:00:02.31
Read that as two different incidents on one screen.
standby-a is receiving and flushing WAL in single-digit milliseconds. Network is fine, its disks are fine. But replay_lag is 47 seconds and replay_lsn trails flush_lsn by a large gap. The WAL is sitting on the standby, already durable, unapplied. That's a replay problem, full stop.
standby-b has 400ms write_lag and 2.3s flush_lag, with replay_lag only 10ms behind flush_lag. Once the bytes land and are fsynced, they get applied almost instantly. The bottleneck is transit plus local durability. Look at the network and the standby's WAL storage, not at replay.
The interval columns tell you time. For bytes, convert the LSN gaps:
SELECT
  application_name,
  state,
  pg_wal_lsn_diff(pg_current_wal_lsn(), sent_lsn)   AS send_bytes,
  pg_wal_lsn_diff(sent_lsn, write_lsn)              AS receive_write_bytes,
  pg_wal_lsn_diff(write_lsn, flush_lsn)             AS fsync_bytes,
  pg_wal_lsn_diff(flush_lsn, replay_lsn)            AS replay_bytes,
  pg_wal_lsn_diff(pg_current_wal_lsn(), replay_lsn) AS total_bytes
FROM pg_stat_replication;
Wrap them in pg_size_pretty() if you'd rather read 1421 MB than a nine-digit integer. Each of those four columns isolates exactly one stage:
pg_current_wal_lsn()minussent_lsn: WAL generated but not yet pushed onto the wire. Send stage.sent_lsnminuswrite_lsn: bytes in flight or buffered but not written by the standby.write_lsnminusflush_lsn: written but not fsynced on the standby. Pure local durability.flush_lsnminusreplay_lsn: safely on the standby's disk, not yet applied. Replay stage.
Don't skip state. It reports the walsender's connection phase — startup, catchup, streaming, backup, stopping. A standby in catchup rather than streaming hasn't reached the primary's current position yet, and that's a fundamentally different situation from a streaming standby that fell behind. catchup after a restart is normal and self-resolving. catchup that persists for an hour means you're generating WAL faster than the replica can consume it, and no amount of squinting at replay_lag will tell you that. Don't tune max_standby_streaming_delay for a standby still in catchup — that's a different problem with a different timeline.
Measuring Staleness on the Standby: pg_last_xact_replay_timestamp
When the application team asks "how stale is the read replica," this is the number they want, run on the standby:
SELECT now() - pg_last_xact_replay_timestamp() AS replication_delay;
It returns the wall-clock age of the last transaction the standby actually replayed. If it says 00:00:00.8, a read hitting that replica sees data that was current 800ms ago. That maps directly onto what a user experiences when they write a row and then read it back from a replica.
The edge case that has burned people: it only advances when new transactions get replayed. On an idle primary at 04:00 with no commits for twenty minutes, this query can report a delay near zero even if the standby is, in LSN terms, far behind and simply hasn't been fed anything to prove otherwise. I've watched an on-call engineer get comfortable with a "healthy" 0.1 second reading during a quiet primary, only to discover the standby was actually 40 minutes behind in applied WAL the moment traffic resumed — the timestamp just hadn't had anything to report against.
So pair it with a byte-based check from pg_stat_wal_receiver on the standby side:
SELECT status, received_lsn, written_lsn, flushed_lsn, latest_end_lsn,
       last_msg_send_time, last_msg_receipt_time,
       last_msg_receipt_time - last_msg_send_time AS transit_time
FROM pg_stat_wal_receiver;
(On PostgreSQL 13 and later, received_lsn was split into written_lsn and flushed_lsn so the standby exposes its own write-versus-fsync state, mirroring the write_lsn/flush_lsn distinction the primary already had. On older versions you get the single received_lsn.)
Single row, because a standby runs exactly one WAL receiver. If that view returns zero rows, the receiver isn't running at all and your "near-zero lag" reading was a lie.
last_msg_receipt_time - last_msg_send_time is the closest thing Postgres gives you to a built-in network transit measurement. Clock skew between hosts pollutes it, so don't treat it as a clean RTT — but a delta that jumps from 3ms to 180ms across a deploy window is a real signal regardless. If that delta stays small while replay_lag is huge, replay is your problem, not the network.
Send Lag: Diagnosis and Fixes
Symptom: pg_wal_lsn_diff(pg_current_wal_lsn(), sent_lsn) is large and growing, while write/flush/replay lag stay small. The standby is keeping up with everything you manage to send it. You just aren't sending fast enough.
Three usual causes.
Network throughput ceiling. A bulk load generating 90 MB/s of WAL across a 1 Gbit link that's also carrying application traffic will never keep up. Check with iftop, nload, or sar -n DEV 1 on the primary and compare observed throughput against your WAL generation rate. Measure the generation rate directly by sampling pg_current_wal_lsn() twice a minute apart and running the difference through pg_wal_lsn_diff().
Primary disk read stalls. The walsender reads WAL from pg_wal. If WAL segments have already been evicted from page cache and your primary is I/O saturated by a checkpoint plus a vacuum plus a hot query pattern, the walsender queues behind everything else. iostat -x 1 on the primary, look at %util and await on the WAL device.
Configuration. max_wal_senders set too low means a new standby (or a base backup, which also consumes a slot) can't connect at all. wal_sender_timeout set aggressively low on a lossy link causes repeated disconnect and reconnect cycles that look like lag but are actually churn. Check pg_stat_replication row count against your expected standby count. A missing row outranks any big number.
Fixes in the order I try them: separate the replication traffic onto its own interface or VLAN, put pg_wal on storage that isn't fighting the data directory, and if you're using synchronous replication, sanity-check synchronous_commit and synchronous_standby_names. A synchronous standby with send-stage problems doesn't just lag — it stalls commits on the primary. Send lag can masquerade as commit-path contention.
Receive Lag: Diagnosis and Fixes
Symptom: sent_lsn runs ahead of write_lsn, or write_lsn runs ahead of flush_lsn by a meaningful margin. The 2.3s flush_lag on standby-b above is exactly this.
The write_lsn to flush_lsn gap is the cleanest signal in the whole view. It's fsync latency on the standby, full stop. No network involved, no replay involved. If that gap is consistently non-trivial, your standby's WAL storage cannot sync as fast as the primary produces.
I have seen this most often when someone builds the primary on NVMe and the standby on network-attached storage because "it's only a replica." That framing misses the job the standby has: it has to durably absorb every byte the primary produces, in real time, forever, no matter how it's provisioned.
Diagnostics: iostat -x 1 on the standby against the device holding pg_wal, plus the transit delta from pg_stat_wal_receiver to rule out the network. Fixes: give the standby WAL storage comparable to the primary's, put pg_wal on its own volume so it isn't queuing behind data file writes and checkpoint flushes, and check wal_receiver_timeout isn't so tight that a brief storage stall kills the connection and forces a reconnect — that turns a transient disk hiccup into receiver churn that looks like receive lag but is actually connection instability.
Replay Lag: The Usual Killer
Most of my 3am pages land here. flush_lag is 11ms, replay_lag is 47 seconds, and the flush_lsn to replay_lsn byte gap is a gigabyte and climbing.
The structural reason: physical WAL replay on a standby is performed by a single startup process. One process, applying records in strict order. Your primary might have 200 concurrent backends generating WAL in parallel across 32 cores; the standby serialises all of that through one CPU and one I/O stream. (PostgreSQL has added parallel apply capability in the logical replication path in recent versions for large streamed transactions, with its own caveats. That does not help physical streaming replicas.) If your primary is doing 5,000 write TPS across 40 cores and your standby is applying that on a box with half the CPU and slower disks, the replay lag you're seeing is just arithmetic catching up with you.
Consequences that follow directly from that:
- A standby with fewer or slower cores than the primary will fall behind under write load, even if its total capacity looks similar on paper. Single-thread performance matters more than core count here.
- A large
DELETEor index build on the primary that took 40 seconds using parallel workers becomes a single-threaded replay job on the standby, and it can easily take longer. - Replay stalls hard on recovery conflicts. If a query on the standby holds a snapshot that conflicts with an incoming WAL record (a vacuum cleanup record, a lock, a dropped tablespace), replay waits.
That last point is where things get ugly. Find the culprit on the standby:
SELECT pid, state, now() - xact_start AS xact_age, wait_event_type, wait_event,
       left(query, 80) AS query
FROM pg_stat_activity
WHERE backend_type = 'client backend'
  AND xact_start IS NOT NULL
ORDER BY xact_start
LIMIT 10;
A reporting query with a 25 minute transaction age at the top of that list, with replay_lag sitting around 25 minutes, is not a coincidence.
max_standby_streaming_delay decides how this resolves. Default is 30 seconds: the standby waits up to 30 seconds for the conflicting query to finish, then cancels it so replay can continue. Set it to -1 and the standby waits indefinitely, which means one careless analyst can drive replay lag to unbounded values. I have watched a replica sit 90 minutes behind because someone set -1 for "no more cancelled queries" and then forgot.
Pick your poison deliberately. Read replicas serving user-facing traffic want a low delay (10 to 30 seconds) and accept cancellations. A dedicated analytics replica that nobody fails over to can afford a delay in the minutes, as long as your monitoring knows that's intentional and doesn't page on it.
The Feedback Loop: hot_standby_feedback Tradeoffs
Mechanically: with hot_standby_feedback = on, the standby includes the oldest xmin still needed by its running queries in the status messages it sends back (plus catalog_xmin for logical/catalog cases). The primary factors that xmin into its cleanup horizon, so vacuum on the primary will not remove dead tuples that a standby query might still need to see. That's the whole point — without it, a long-running standby query can simply get killed mid-flight when the primary vacuums away a row it was reading. With it on, standby queries stop getting cancelled by cleanup conflicts.
The bill arrives on the primary. Vacuum can't reclaim those dead tuples, so tables and indexes bloat. Bloated tables mean more pages touched per query, more pages dirtied, more full-page images, and more WAL generated. More WAL means more bytes for the single-threaded startup process on the standby to replay. Replay lag grows, the long standby query runs longer because the replica is now busier, its xmin stays pinned even longer, and around it goes. This loop is mechanical, not figurative — each step drives the next one directly.
This is the same shape as the classic autovacuum starvation incident: something holds the cleanup horizon (a stuck feedback xmin, an abandoned prepared transaction, an idle-in-transaction session), bloat accumulates, WAL volume inflates, and the WAL volume itself becomes the outage when pg_wal fills the disk. The trigger differs, the failure curve is identical.
Note that hot_standby_feedback defaults to off. Plenty of teams assume it's on because someone mentioned it in a design doc three years ago. Verify with SHOW hot_standby_feedback; on each standby rather than trusting the doc.
My decision framework:
- Enable it when the standby runs short-to-medium read queries that must not be cancelled, and the primary's write volume is low enough that a few minutes of held-back cleanup won't matter.
- Leave it off when the standby runs long analytical queries against a high-write primary. Cancelled queries are recoverable; primary-side bloat cascading into WAL inflation is not, at least not cheaply. Manage the cancellation risk with a generous
max_standby_streaming_delayon that specific replica instead, or enforcestatement_timeouton the standby so no single session can hold the xmin hostage for an hour. - Never enable it on a replica where an unattended session can hold a transaction open indefinitely without something (a
statement_timeout, anidle_in_transaction_session_timeout) eventually killing it.
If you enable it, monitor backend_xmin in pg_stat_replication and n_dead_tup in pg_stat_user_tables on the primary. A backend_xmin that stops advancing is the early warning.
A Practical Lag Triage Checklist
At 03:14, in order:
- On the primary, run the
pg_stat_replicationquery. Confirm a row exists for every expected standby. A missing row outranks any lag number. - Check
state. If it'scatchup, the standby is still catching up from a restart or a long disconnect. Watch whetherreplay_lsnis advancing at all before doing anything else. - Compare the four LSN gaps with
pg_wal_lsn_diff(). Whichever gap dominates names the stage. - Go to the matching row below.
| Dominant signal | Stage | Likely cause | First fix |
|---|---|---|---|
pg_current_wal_lsn() to sent_lsn gap growing |
Send | Network saturated, or walsender starved on primary CPU/disk reads | Check link throughput vs WAL generation rate; iostat -x on primary WAL device; isolate replication traffic |
High write_lag, small flush_lag delta |
Receive (network/write) | Transit latency or standby write queue | Compare last_msg_receipt_time - last_msg_send_time in pg_stat_wal_receiver; check standby WAL device queue depth |
write_lsn to flush_lsn gap large, flush_lag seconds |
Receive (fsync) | Standby WAL storage too slow | Faster standby storage, dedicated pg_wal volume |
flush_lsn to replay_lsn gap large, replay_lag seconds to minutes |
Replay | Single-threaded startup process saturated, or a conflicting standby query blocking replay | pg_stat_activity on standby for long transactions; check max_standby_streaming_delay; verify standby CPU is comparable to primary |
replay_lag growing over days, primary bloat visible |
Feedback loop | hot_standby_feedback pinning xmin against a long-running query |
Disable feedback or enforce query timeouts on the standby |
| All lags jump in fixed steps of ~10s or more | Measurement artifact | wal_receiver_status_interval too coarse |
Lower it back toward the 10s default |
state = 'catchup' for a long time |
Whole pipeline | Sustained WAL generation exceeds standby throughput | Reduce write burst, or upgrade standby to match primary |
now() - pg_last_xact_replay_timestamp() near zero but replica clearly stale |
Idle primary | No new transactions to replay | Cross-check with pg_stat_wal_receiver and LSN byte gaps |
Monitoring So You Don't Find Out From an Angry User
Alert on the byte gaps, not just the interval columns, because the intervals go quiet exactly when the primary goes idle. My baseline set:
- Total byte lag (
pg_current_wal_lsn()toreplay_lsn) exceeding roughly one WAL segment's worth of sustained backlog, warning; ten segments, page. replay_lagabove 60 seconds on any replica in the failover pool, page immediately. That number is your RPO exposure.- Any expected standby missing from
pg_stat_replication, page immediately. statestuck atcatchupfor more than 15 minutes.- Any replication slot with
active = falseand a growingrestart_lsndistance, because that is the slot quietly pinning WAL untilpg_walfills the disk. This doesn't show up as lag at all — it shows up as a full disk instead — and it has caused more genuine outages in my experience than lag itself. - WAL archiver failures in
pg_stat_archiver, for the same reason.
If you'd rather not build all of that yourself, MyDBA (https://mydba.dev/?utm_source=wordpress&utm_medium=platform&utm_campaign=postgres-replication-lag-is-four-numbers-not-one) runs a free health check that tracks replication lag trends, flags inactive or orphaned replication slots along with the drop SQL, and reports WAL archiver health on a schedule. It catches the slow-burn problems (a slot left behind after a decommissioned replica, an archiver that started failing on Tuesday) that don't page anyone until the disk fills.
Whatever tooling you use, the discipline is the same. When someone says "the replica is lagging," your next move is a query that returns four LSNs and three intervals, not a ticket to the storage team. The view already knows which stage broke. You just have to read it.